An interesting article at WUWT, Why herd immunity to COVID-19 is reached much earlier than thought #coronavirus
The ‘herd immunity threshold’ (HIT) can be estimated from the basic reproduction rate of the epidemic, R0 – a measure of how many people, on average, each infected individual infects. Standard simple compartmental models of epidemic growth imply that the HIT equals {1 – 1/R0}. Once the HIT is passed, the rate of new infections starts to decline, which should ensure that health systems will not thereafter be overwhelmed and makes it more practicable to take steps to eliminate the disease.One thing that bothers me in these discussions is that we tend to talk about R0 as if it was a natural constant, like Planck's Constant, a fixed property of the virus. It is not; it's an emperical number derived from the interaction of a virus with a supposedly naive population. But, certainly, not all populations are equal. Certainly Wyoming rancher would have a much lower R0 than New York subway riders, given the same infectiousness of the virus, just based on their vastly different degree of interactions with other people. But let's go on
However, the Ferguson20 report estimated that relying on herd immunity would result in 81% of the UK and US populations becoming infected during the epidemic, mainly over a two-month period, based on an R0 estimate of 2.4. These figures imply that the HIT is between 50% and 60%. Their report implied that health systems would be overwhelmed, resulting in far more deaths. It claimed that only draconian government interventions could prevent this occurring. Such interventions were rapidly implemented in the UK, in most states of the US, and in various other countries, via highly disruptive and restrictive enforced ‘lockdowns’.
A notable exception was Sweden, which has continued to pursue a herd immunity-based strategy, relying on relatively modest social distancing policies. The Imperial College team estimated that, after those policies were introduced in mid-March, R0 in Sweden was 2.5, with only a 2.5% probability that it was under 1.5. The rapid spread of COVID-19 in the country in the second half of March suggests that R0 is unlikely to have been significantly under 2.0.
Very sensibly, the Swedish public health authority has surveyed the prevalence of antibodies to the SARS-COV-2 virus in Stockholm County, the earliest in Sweden hit by COVID-19. They thereby estimated that 17% of the population would have been infected by 11 April, rising to 25% by 1 May 2020. Yet recorded new cases had stopped increasing by 11 April (Figure 1), as had net hospital admissions, and both measures have fallen significantly since. That pattern indicates that the HIT had been reached by 11 April, at which point only 17% of the population appear to have been infected.
How can it be true that the HIT has been reached in Stockholm County with only about 17% of the population having been infected, while an R0 of 2.0 is normally taken to imply a HIT of 50%?
A recent paper (Gomes et al.) provides the answer. It shows that variation between individuals in their susceptibility to infection and their propensity to infect others can cause the HIT to be much lower than it is in a homogeneous population. Standard simple compartmental epidemic models take no account of such variability. And the model used in the Ferguson20 study, while much more complex, appears only to take into account inhomogeneity arising from a very limited set of factors – notably geographic separation from other individuals and household size – with only a modest resulting impact on the growth of the epidemic. Using a compartmental model modified to take such variability into account, with co-variability between susceptibility and infectivity arguably handled in a more realistic way than by Gomes et al., I confirm their finding that the HIT is indeed reached at a much lower level than when the population is homogeneous. That would explain why the HIT appears to have been passed in Stockholm by mid April. The same seems likely to be the case in other major cities and regions that have been badly affected by COVID-19.What, you mean people are different?
Like Gomes et al., I use a simple ‘SEIR’ epidemiological model,[9] in which the population is divided into four compartments: Susceptible (uninfected), Exposed (latent: infected but not yet infectious), Infectious (typically when diseased), and Recovered (and thus immune and harmless). This is shown in Figure 2. In reality, the Recovered compartment includes people who instead die, which has the same effect on the model dynamics. The entire population starts in the Susceptible compartment, save for a tiny proportion that are transferred to the Infectious compartment to seed the epidemic. The seed infectious individuals infect Susceptible individuals, who move to the Exposed compartment. Exposed individuals gradually transfer to the Infectious compartment, on average remaining as Exposed for the chosen latent period. Infectious individuals in turn gradually transfer to the Recovered compartment, on average remaining as Infectious for the selected infectious period.
The Ferguson20 model assumed a generation time of 6.5 days, slightly lower than a subsequent estimate of 7.5 days. I use 7 days, which is consistent with growth rates near the start of COVID-19 outbreaks. The infectious period is therefore 4 (=7 − 3) days.So, that sucks. 0.88 X 328 million people X even 0.01 (1%) death rate is a lot of people. But, if you assume that not all people are equal . . .
I set R0=2.4, the same value Ferguson20 use. On average, while an individual is in the Infectious compartment, the number of Susceptible individuals they infect is R0 × {the proportion of the population that remains in the Susceptible compartment}.
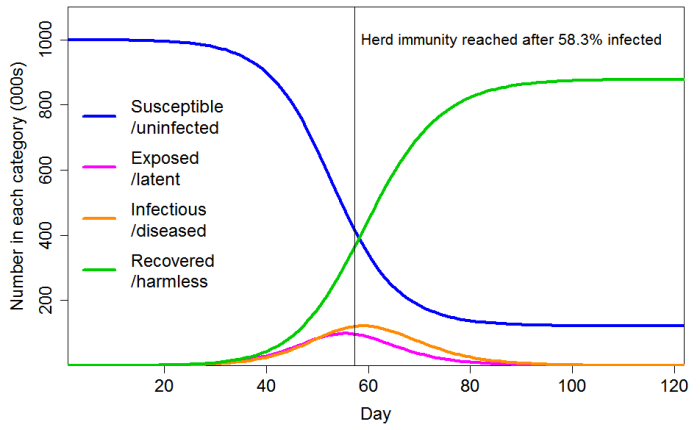
With these settings, the progression of a COVID-19 epidemic projected by a standard SEIR model, in which all individuals have identical characteristics, is as shown in Figure 3. The HIT is reached once 58% of the population has been infected, and ultimately 88% of the population become infected.
I consider the cases of CV=1 and CV=2 for the common social connectivity factor that causes inhomogeneity in both susceptibility and infectivity. For unrelated lognormally-distributed inhomogeneity in susceptibility I take standard deviations of either 0.4 or 0.8, corresponding to a CV of 0.417 or 0.947 respectively. Where their gamma-distributed common factor inhomogeneity is set at 1, the resulting total inhomogeneity in susceptibility is respectively 1.17 or 1.65 when the lower or higher unrelated inhomogeneity standard deviations respectively are used; where set at 2 the resulting total inhomogeneity in susceptibility is respectively 2.17 or 2.98. The magnitude of variability in individuals’ social-connectivity unrelated infectivity-specific inhomogeneity factor does not affect the progression of an epidemic or the HIT, so for simplicity I ignore it here.

Figure 4 shows the progression of a COVID-19 epidemic in the case of CV=1 for the common social connectivity factor inhomogeneity, with unrelated inhomogeneity in susceptibility having a standard deviation of 0.4. The HIT is 60% lower than for a homogeneous population, at 23.6% rather than 58.3% of the population. And 43% rather than 88% of the population ultimately becomes infected. If the standard deviation of unrelated inhomogeneity in susceptibility is increased to 0.8, the HIT becomes 18.9%, and 35% of the population are ultimately infected.Well, that only sucks about half as bad, and in fact, the seropositivity results from New York City suggest that about 20% of the population have already been infected. And remember, NYC is sort of a worst case scenario for the United States, crowded, with mass transit basically mandated.
With a little effort, we in the more rural areas of the should be able to keep our R0 safely below 1. If people from the urban centers would stay away (and if we could avoid going there and getting infected) we should be able to keep the numbers of WuFlu cases to minimum, while it burns its way through the cities.
Please remember Box's Law: "All models are wrong, but some are useful"
No comments:
Post a Comment