The sun roared to life early Tuesday (May 14), unleashing a powerful X-class solar flare from a newly emerging sunspot region AR4087. The eruption peaked at 4:25 a.m. EDT (0825 GMT), triggering strong R3-level radio blackouts across Europe, Asia and the Middle East — the sunlit side of Earth at the time — as sunspot region 2087 crackles with activity.It would be great to see some auroras again!
Solar flares of this magnitude are uncommon, according to the NOAA Space Weather Prediction Center (SWPC). Solar flares are ranked by strength in five classes: A, B, C, M and X, with each step representing a tenfold increase in energy. The recent X flare clocked in at X2.7, placing it at the lower end of the most powerful solar flare class.
The eruption sent a blast of X-rays and extreme ultraviolet radiation hurling toward Earth at the speed of light, rapidly ionizing the upper atmosphere. This sudden change disrupted high-frequency radio signals, leading to communication dropouts for some radio operators across affected regions.
There may have been an associated coronal mass ejection (CME) — massive plumes of solar plasma and magnetic field accompanying the X-flare, though it is yet to be confirmed. CMEs can spark geomagnetic storms and vibrant auroras if they collide with Earth's magnetic field. But with AR4087 still near the sun's edge, our planet is out of the line of fire. For now. That may change soon as AR4087 is rotating toward Earth and has already fired off multiple solar flares.
One day you wash up on the beach, wet and naked. Another day you wash back out. In between, the scenery changes constantly.
Sunday, May 18, 2025
Sunday Sunrise
Saturday, April 24, 2021
Artificial Intelligence Predicts Continued Sunspot Drought
WUWT, Scientists use AI to predict sunspot cycles
For the first time, scientists have used artificial intelligence not only to predict sunspots but also to correct the incomplete record of past sunspot activity.
A new paper just published in Advances in Space Research by Dr Victor Velasco Herrera, a theoretical physicist at the National Autonomous University of Mexico, Dr Willie Soon, an award-winning solar astrophysicist at the Harvard-Smithsonian Center for Astrophysics, and Professor David Legates, a climatologist at the University of Delaware and former director of the U.S. Global Change Research Program, predicts that the new 11-year solar cycle that has recently begun will show near-record low sunspot activity that will last until mid-century.
Both Dr Soon (in 2004) and Dr Velasco Herrera (in 2008) had previously published papers speculating that the first half of the 21st century would be a period of unusually few sunspots, potentially slowing the rate of global warming.
. . .
The three scientists taught a machine-learning algorithm how to recognize underlying patterns and cycles in the past 320 years’ sunspot record. The algorithm then discovered a hitherto-unnoticed interaction between the 5.5-year solar half-cycles (blue) and the 120-year Gleissberg double cycles (red dotted lines) which allowed it to confirm the earlier predictions of a quiet half-century to come – predictions which are now shared by solar physicists.
That interaction between the two periodicities led the algorithm to indicate that from the 1730s to the 1760s, early in the modern sunspot record (the gray band below), sunspots appear to have been under-recorded: as the 120-year cycle approached its maximum amplitude, sunspots should have been more numerous than reported at the time.
The algorithm then predicted the sunspots from 2021 to 2100. It suggests that the current low solar activity is likely to continue until 2050:
There is still a reasonable hypothesis that solar weather affects the earth's climate, with lower solar sunspot activity correlated with cooler temperatures. A reasonable mechanism (the Svensmark hypothesis) has been postulated, that low solar activity allows more cosmic rays to reach the atmosphere, which seeds cloud nucleation, which shadow the earth and lower temperatures, but the link has not been "proven" to everyone's satisfaction, if that could happen. Certainly, previous periods of low sunspot activity, the Maunder and Dalton sunspots minima, periods of colder than average climate. This model predicts 3 more 11ish year cycles before the return of higher activity; plenty of time for a rigorous test of the model.
And let's not forget this is just a model (you could call it a hypothesis too), and will ultimately be tested against the way the cycles develop in the future. The literature is littered with tuned models that predicted the past well, and then fail to predict the future.
Thursday, June 18, 2015
Weird Science: Is Arthritis Caused by Sunspots?
What began as a chat between husband and wife has evolved into an intriguing scientific discovery. The results, published in May in BMJ (formerly British Medical Journal) Open, show a “highly significant” correlation between periodic solar storms and incidences of rheumatoid arthritis (RA) and giant cell arteritis (GCA), two potentially debilitating autoimmune diseases. The findings by a rare collaboration of physicists and medical researchers suggest a relationship between the solar outbursts and the incidence of these diseases that could lead to preventive measures if a causal link can be established.Of course, there's the whole lynx, hare, sunspot cycle deal, but it's still controversial.
RA and GCA are autoimmune conditions in which the body mistakenly attacks its own organs and tissues. RA inflames and swells joints and can cause crippling damage if left untreated. In GCA, the autoimmune disease results in inflammation of the wall of arteries, leading to headaches, jaw pain, vision problems and even blindness in severe cases.
Inspiring this study were conversations between Simon Wing, a Johns Hopkins University physicist and first author of the paper, and his wife, Lisa Rider, deputy unit chief of the Environmental Autoimmunity Group at the National Institute of Environmental Health Sciences in the National Institutes of Health, and a coauthor. Rider spotted data from the Mayo Clinic in Rochester, Minnesota, showing that cases of RA and GCA followed close to 10-year cycles. “That got me curious,” Wing recalled. “Only a few things in nature have a periodicity of about 10-11 years and the solar cycle is one of them.”
The research, which tracked correlations of the diseases with both geomagnetic activity and extreme ultraviolet (EUV) solar radiation, focused on cases recorded in Olmsted County, Minnesota, the home of the Mayo Clinic, over more than five decades. The physicists compared the data with indices of EUV radiation for the years 1950 through 2007 and indices of geomagnetic activity from 1966 through 2007. Included were all 207 cases of GCA and all 1,179 cases of RA occurring in Olmsted County during the periods and collected in a long-term study led by Sherine Gabriel, then of the Mayo Clinic and now dean of the Rutgers Robert Wood Johnson Medical School.Of course, this is only a correlative study, and doesn't prove causation; but the notion that RA and GCA are causing the solar cycle is plainly silly, so it's reasonable to start looking for answers that relate to the solar cycles.
Correlations proved to be strongest between the diseases and geomagnetic activity. GCA incidence — defined as the number of new cases per capita per year in the county — regularly peaked within one year of the most intense geomagnetic activity, while RA incidence fell to a minimum within one year of the least intense activity. Correlations with the EUV indices were seen to be less robust and showed a significantly longer response time.
The findings were consistent with previous studies of the geographic distribution of RA cases in the United States. Such research found a greater incidence of the disease in sections of the country that are more likely to be affected by geomagnetic activity. For example, the heaviest incidence lay along geographic latitudes on the East Coast that were below those on the West Coast. This asymmetry may reflect the fact that high geomagnetic latitudes — areas most subject to geomagnetic activity — swing lower on the East Coast than on the opposite side of the country. While Washington, D.C., lies just 1 degree farther north than San Francisco geographically, for example, the U.S. capital is 7 degrees farther north in terms of geomagnetic latitude.
Since RA has been linked to Lyme Disease I would think that the effects of solar cycles on weather, and the effects of weather on tick borne disease should be among the factors considered.
Wombat-socho has the weekly compendium up at The Other McCain: "Rule 5 Sunday: Pipe Dreams."
Tuesday, April 7, 2015
Seasons in the Sun
The Sun undergoes a type of seasonal variability with its activity waxing and waning over the course of nearly two years, according to a new study by a team of researchers led by the National Center for Atmospheric Research (NCAR). This behavior affects the peaks and valleys in the approximately 11-year solar cycle, sometimes amplifying and sometimes weakening the solar storms that can buffet Earth’s atmosphere.Of course, one difference is that the seasons on earth are driven by the tilt of the Earth's rotation with respect to the sun, and the orbit of the earth around the Sun. No such effect is expected from the Sun, and the cycles are most likely endogenous.
The quasi-annual variations appear to be driven by changes in the bands of strong magnetic fields in each solar hemisphere. These bands also help shape the approximately 11-year solar cycle that is part of a longer cycle that lasts about 22 years.
“What we’re looking at here is a massive driver of solar storms,” said Scott McIntosh, lead author of the new study and director of NCAR’s High Altitude Observatory. “By better understanding how these activity bands form in the Sun and cause seasonal instabilities, there’s the potential to greatly improve forecasts of space weather events.”
The overlapping bands are fueled by the rotation of the Sun’s deep interior, according to observations by the research team. As the bands move within the Sun’s northern and southern hemispheres, activity rises to a peak over a period of about 11 months and then begins to wane. The quasi-annual variations can be likened to regions on Earth that have two seasons, such as a rainy season and a dry season, McIntosh said.
Tuesday, December 31, 2013
The Sun Flips Out, Again
And NOAA made a video to illustrate it:
The entire sun’s magnetic polarity, flips approximately every 11 years — though sometimes it takes quite a bit longer — and defines what’s known as the solar cycle. The visualization shows how in 1997, the sun shows the positive polarity on the top, and the negative polarity on the bottom. Over the next 12 years, each set of lines is seen to creep toward the opposite pole eventually showing a complete flip. By the end of the movie, each set of lines are working their way back to show a positive polarity on the top to complete the full 22 year magnetic solar cycle.
At the height of each magnetic flip, the sun goes through periods of more solar activity, during which there are more sunspots, and more eruptive events such as solar flares and coronal mass ejections, or CMEs. The point in time with the most sunspots is called solar maximum.
In all likelihood, this means that sunspot activity, still low by historical standards for activity at the height of a solar cycle, will now start to decline to the beginning of the next cycle.
What does this mean for the earth? We don't know, but historically, periods of low sunspot activity are periods of cool to cold climate.
Saturday, December 14, 2013
Five Years Ago Yesterday...
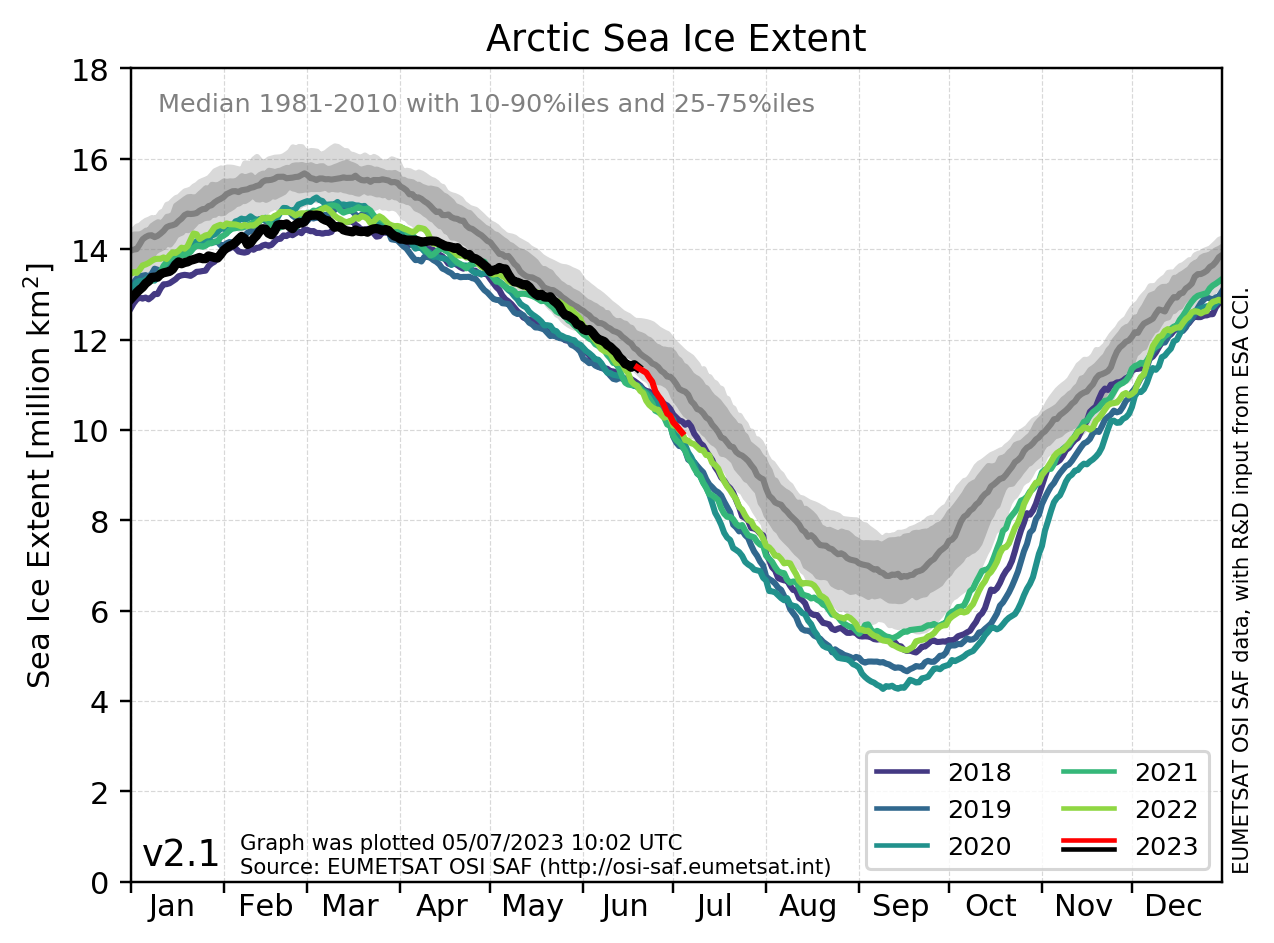
As you can see below, the Arctic ice cap is still going strong, and increasing towards it's annual summer maximum sometime in March.
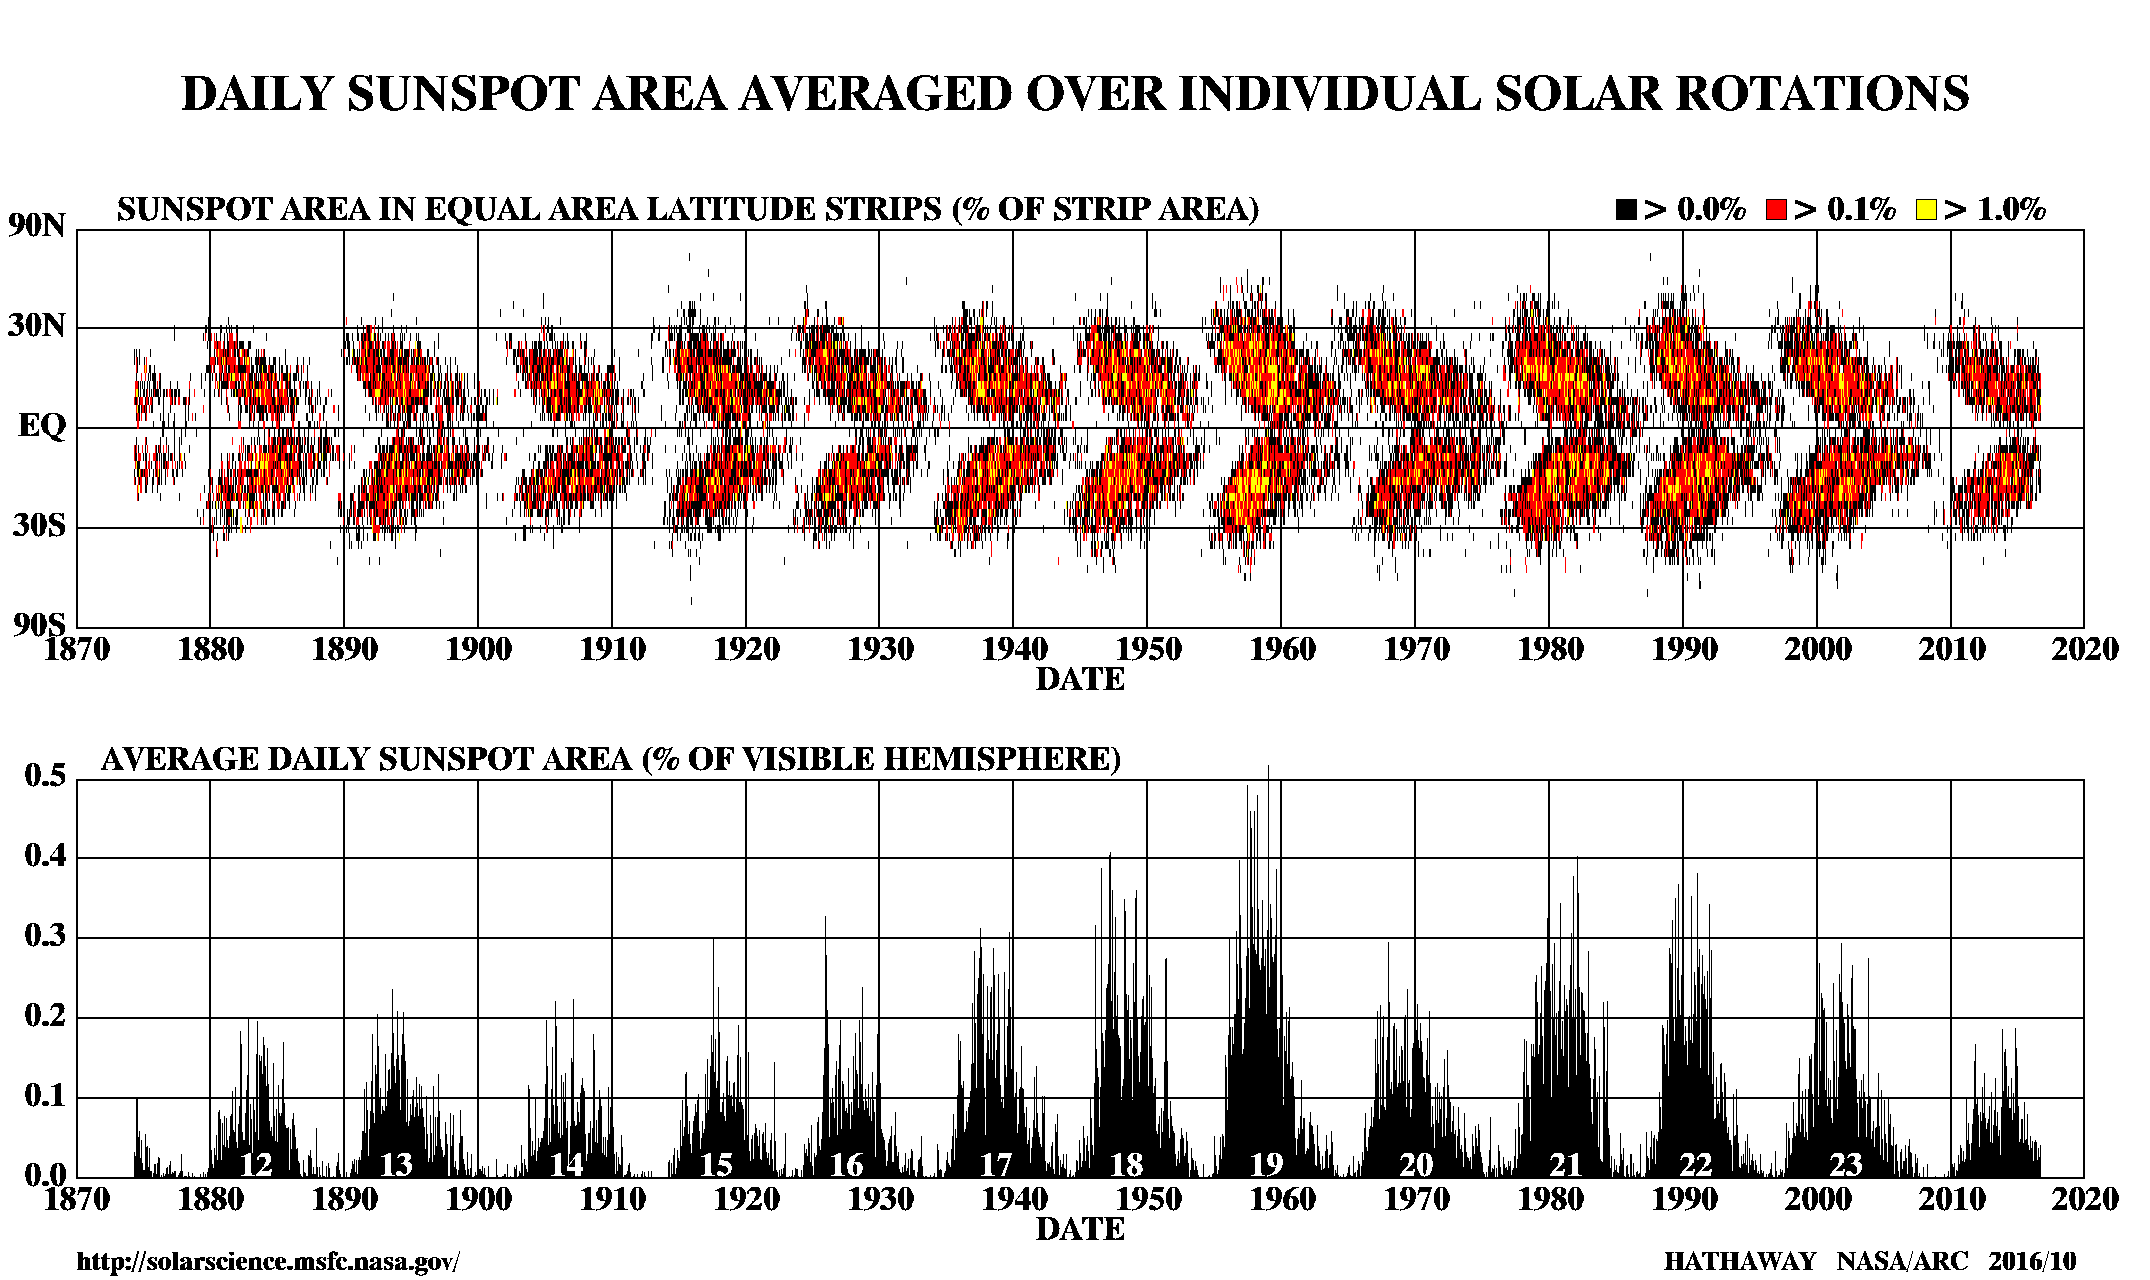
Perhaps coincidentally, or perhaps not, solar scientists at the American Geophysical Meeting in San Francisco said that the magnetic activity of the sun, and the the sunspot cycle, on the other hand, is declining to lows not seen in 100 years:
Also possibly coincidentally, or perhaps not, Cairo, Egypt had it's first snow in 112 years:
Friday, September 6, 2013
Cosmic Ray/Weather Link Passes Experimental Test
Researchers in the Technical University of Denmark (DTU) are hard on the trail of a previously unknown molecular process that helps commonplace clouds to form. Tests in a large and highly instrumented reaction chamber in Lyngby, called SKY2, demonstrate that an existing chemical theory is misleading.
Back in 1996 Danish physicists suggested that cosmic rays, energetic particles from space, are important in the formation of clouds. Since then, experiments in Copenhagen and elsewhere have demonstrated that cosmic rays actually help small clusters of molecules to form. But the cosmic-ray/cloud hypothesis seemed to run into a problem when numerical simulations of the prevailing chemical theory pointed to a failure of growth.
Fortunately the chemical theory could also be tested experimentally, as was done with SKY2, the chamber of which holds 8 cubic metres of air and traces of other gases. One series of experiments confirmed the unfavourable prediction that the new clusters would fail to grow sufficiently to be influential for clouds. But another series of experiments, using ionizing rays, gave a very different result, as can be seen in the accompanying figure.
Nature also seems to be doing this experiment for us in the upcoming years. The current sunspot cycle, #24, is proving to be a dud, as the sun's magnetic field and is declining to unheard of levels since the age of modern instrumentation. As the solar magnetic field declines, more cosmic rays will strike the earth's atmosphere. If this indeed produces more clouds, the earth will likely experience another cooling period like the Maunder and Dalton sunspot minimums.Simulating what could happen in the atmosphere, the DTU’s SKY2 experiment shows molecular clusters (red dots) failing to grow enough to provide significant numbers of “cloud condensation nuclei” (CCN) of more than 50 nanometres in diameter. This is what existing theories predict. But when the air in the chamber is exposed to ionizing rays that simulate the effect of cosmic rays, the clusters (blue dots) grow much more vigorously to the sizes suitable for helping water droplets to form and make clouds. (A nanometre is a millionth of a millimetre.)
Wednesday, July 31, 2013
Did Civilization Just Dodge a Bullet?
The earth barely missed taking a massive solar punch in the teeth two weeks ago, an "electromagnetic pulse" so big that it could have knocked out power, cars and iPhones throughout the United States.
Two EMP experts told Secrets that the EMP flashed through earth's typical orbit around the sun about two weeks before the planet got there.

I wonder about this. Solar activity is pretty widely observed, and if a Carrington level event had occurred, even aimed elsewhere than earth, I
"The world escaped an EMP catastrophe," said Henry Cooper, who led strategic arms negotiations with the Soviet Union under President Reagan, and who now heads High Frontier, a group pushing for missile defense.
"There had been a near miss about two weeks ago, a Carrington-class coronal mass ejection crossed the orbit of the Earth and basically just missed us," said Peter Vincent Pry, who served on the Congressional EMP Threat Commission from 2001-2008. He was referring to the 1859 EMP named after astronomer Richard Carrington that melted telegraph lines in Europe and North America.
"Basically this is a Russian roulette thing," added Pry. "We narrowly escape from a Carrington-class disaster."
Estimates are that "Carrington" level events happen approximately twice per millennium (they leave traces in ice cores), and events one fifth as big every century. However, given Earth's relatively small size compared to the Sun, and the directionality of solar flares, we're likely to observe quite a few before actually being struck by one.
Since the sun rotates approximately 14 degrees a day, a 2 week miss was a big miss.
Wednesday, May 15, 2013
Spooky Action at a Distance Helps Predict Solar Flares
New system could predict solar flares, give advance warning
Researchers may have discovered a new method to predict solar flares more than a day before they occur, providing advance warning to help protect satellites, power grids and astronauts from potentially dangerous radiation.So how does it work; what causes the change in the decay rates?
The system works by measuring differences in gamma radiation emitted when atoms in radioactive elements "decay," or lose energy. This rate of decay is widely believed to be constant, but recent findings challenge that long-accepted rule.
...
Fischbach and Jere Jenkins, a nuclear engineer and director of radiation laboratories in the School of Nuclear Engineering, are leading research to study the phenomenon and possibly develop a new warning system. Jenkins, monitoring a detector in his lab in 2006, discovered that the decay rate of a radioactive sample changed slightly beginning 39 hours before a large solar flare.
Since then, researchers have been examining similar variation in decay rates before solar flares, as well as those resulting from Earth's orbit around the sun and changes in solar rotation and activity. The new findings appeared online last week in the journal Astroparticle Physics.
The new detection technique is based on a hypothesis that radioactive decay rates are influenced by solar activity, possibly streams of subatomic particles called solar neutrinos. This influence can wax and wane due to seasonal changes in the Earth's distance from the sun and also during solar flares, according to the hypothesis, which is supported with data published in a dozen research papers since it was proposed in 2006, said Ephraim Fischbach, a Purdue University professor of physics.OK, I can imagine that; we're constantly bathed with an unseen rain of solar neutrinos, very fast, very light particle emitted in radioactive decay and fusion reactions, that carry off variable amounts of energy from the reactions. While they rarely interact with particles, they do interact enough to be measurable. Could it be that solar neutrinos can trigger the decay of unstable nuclei, and that changes in the solar neutrino flux from the above factors is causing the cyclic changes in radioactive decay associated with the sun and solar flares?
Cool stuff; the science isn't settled yet.
Thursday, March 7, 2013
Sun Continues to Perform Below Expectations
The data from SWPC is in, and it is lethargic at best. Sunspot numbers took a hit, down to about 42, a delta of ~50 lower compared to the red prediction line.
but NASA says ‘twin peaks’ may happen
Pesnell notes yet another complication: “The last two solar maxima, around 1989 and 2001, had not one but two peaks.” Solar activity went up, dipped, then resumed, performing a mini-cycle that lasted about two years.This isn't really so much about whether the sun is getting weaker or not, though the sun does dim by a trivial amount during the cycles of low sunspot activity. The real concern is that times of low sunspot activity have historically been a correlated to periods of cool climate for unknown reasons, although evidence is beginning to point to a solar magnetic field ->cosmic ray-> cloud initiation linkage. Such periods as the Maunder and Dalton Sunspot minimas had cooler than average climate and poor agriculture. Are we headed into such a period now? We just don't know. Clearly, our ability to predict solar activity is still less than perfect.
The same thing could be happening now. Sunspot counts jumped in 2011, dipped in 2012, and Pesnell expects them to rebound again in 2013: “I am comfortable in saying that another peak will happen in 2013 and possibly last into 2014,” he predicts.
Thursday, May 3, 2012
What's Up With the Sun?
The current prediction for Sunspot Cycle 24 gives a smoothed sunspot number maximum of about 60 in the Spring of 2013. We are currently over three years into Cycle 24. The current predicted size makes this the smallest sunspot cycle in about 100 years.This matters if you believe that the sunspot cycle strongly effects the earth's climate. Evidence suggests that in the past, the low sunspot cycles of the Maunder and Dalton minimums coincide with periods of cool average climate on Earth. Recent progression of the cycle suggests that the sun may be going into a minimum now, which may rival the Dalton minimum, and may reach the low levels seen in the Maunder minimum.
The prediction method has been slightly revised. The previous method found a fit for both the amplitude and the starting time of the cycle along with a weighted estimate of the amplitude from precursor predictions (polar fields and geomagnetic activity near cycle minimum). Recent work [see Hathaway Solar Physics; 273, 221 (2011)] indicates that the equatorward drift of the sunspot latitudes as seen in the Butterfly Diagram follows a standard path for all cycles provided the dates are taken relative to a starting time determined by fitting the full cycle. Using data for the current sunspot cycle indicates a starting date of May of 2008. Fixing this date and then finding the cycle amplitude that best fits the sunspot number data yields the current (revised) prediction.
A mechanism for the relationship between the sunspot cycle has been proposed. The solar magnetic field (also tied to sunspots) deflects cosmic rays from earth. Cosmic rays, in turn, ionize atoms in the Earth's atmosphere, and help to seed clouds. Thus, periods of low sunspots correlate to greater cloudiness, high albedo, and lower temperatures on Earth.
So far, every revision of the next solar cycle has been downward. Will they earth's climate cool as solar activity recedes? Stay tuned for further developments:
Previous posts on the solar cycle/climate link:
Japanese Scientists Warm of Cooling Climate
A View from the Beach: Ain't No Sunspots...
Solar Magnetic Activity Linked to Climate Via Cosmic Rays
Solar Breakdown - AAS Predicts Solar Minimum
CERN Head Censors Scientific Thinking
Dalton or Maunder?
CERN Study Finds-Climate Cosmic Ray Link
Found at Watts Up With That.